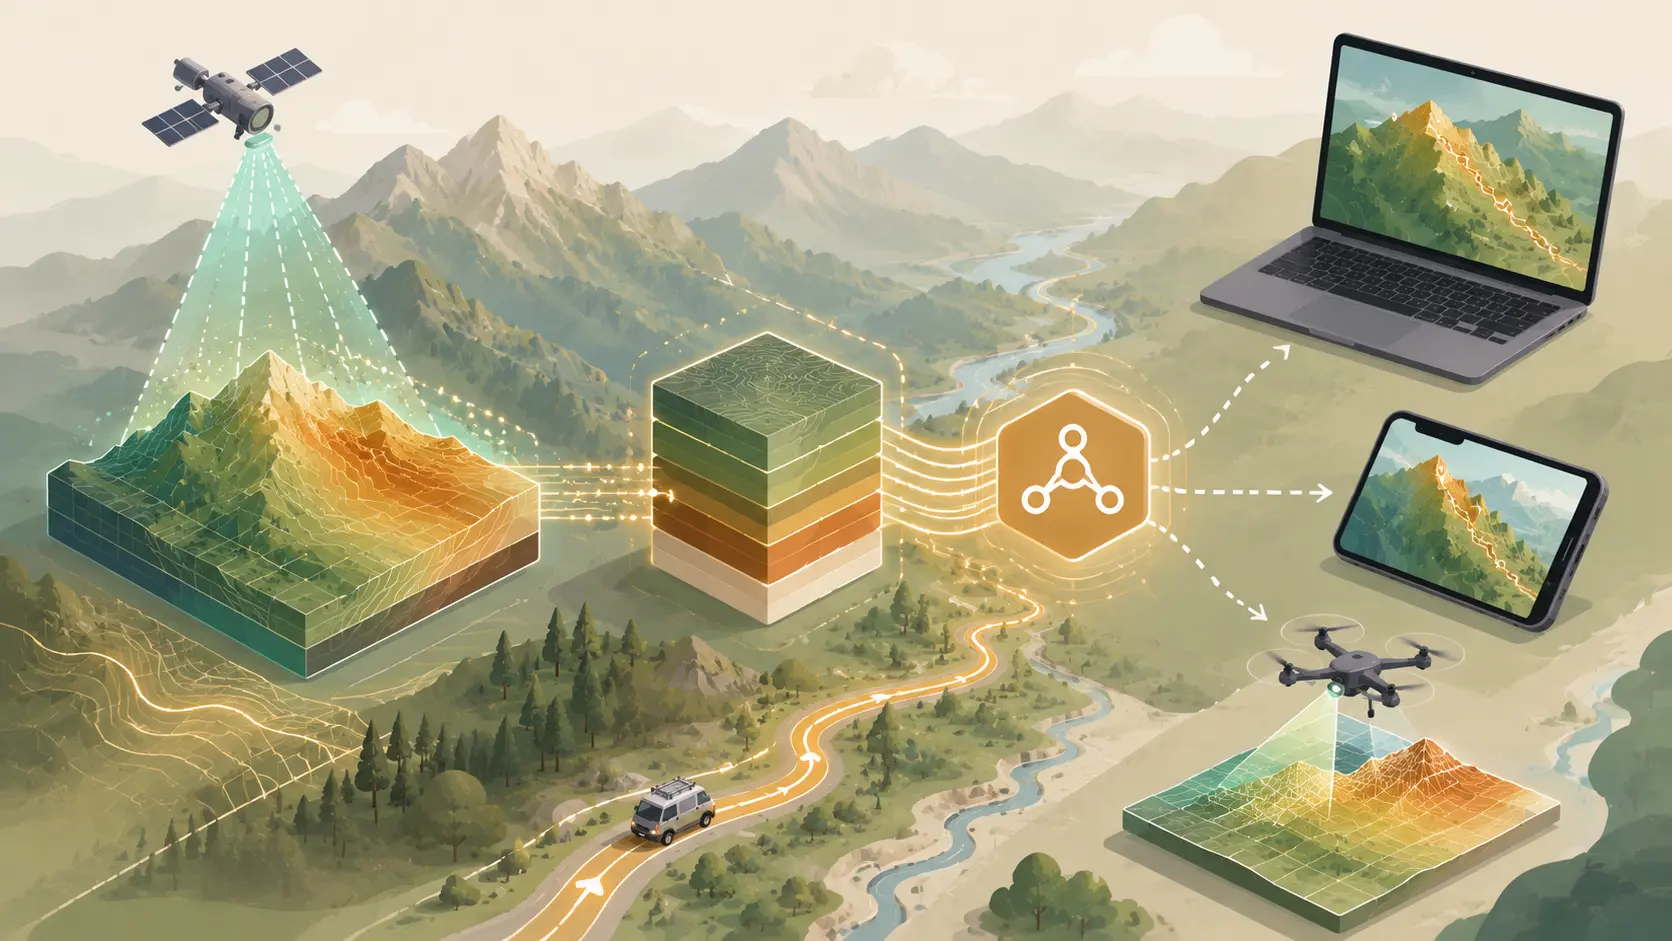
Elevation data is a numeric measurement of height above sea level for every point on a map. It is what lets software understand terrain instead of just streets and boundaries. Developers care about elevation because it changes route timing, powers flood and landslide risk models, drives EV range calculations, and makes outdoor and agricultural apps usable. This guide covers where elevation data comes from, how accurate it is, how elevation APIs work, how to add elevation to routing and maps, and how to choose a provider. You can try a live example immediately with Farun’s Elevation Explorer.
What Is Elevation Data in Maps?
Elevation data is a set of height measurements, usually in meters above sea level, attached to specific locations on a map. It turns a flat, two-dimensional map into something software can use to understand slope, terrain, and vertical change.
A flat map shows roads, boundaries, and labels. Elevation data adds a third dimension: a z-value at every x/y coordinate. Knowing that point A is at 12 meters and point B is at 340 meters tells an app there is a serious climb between them. A flat road map cannot provide that information.
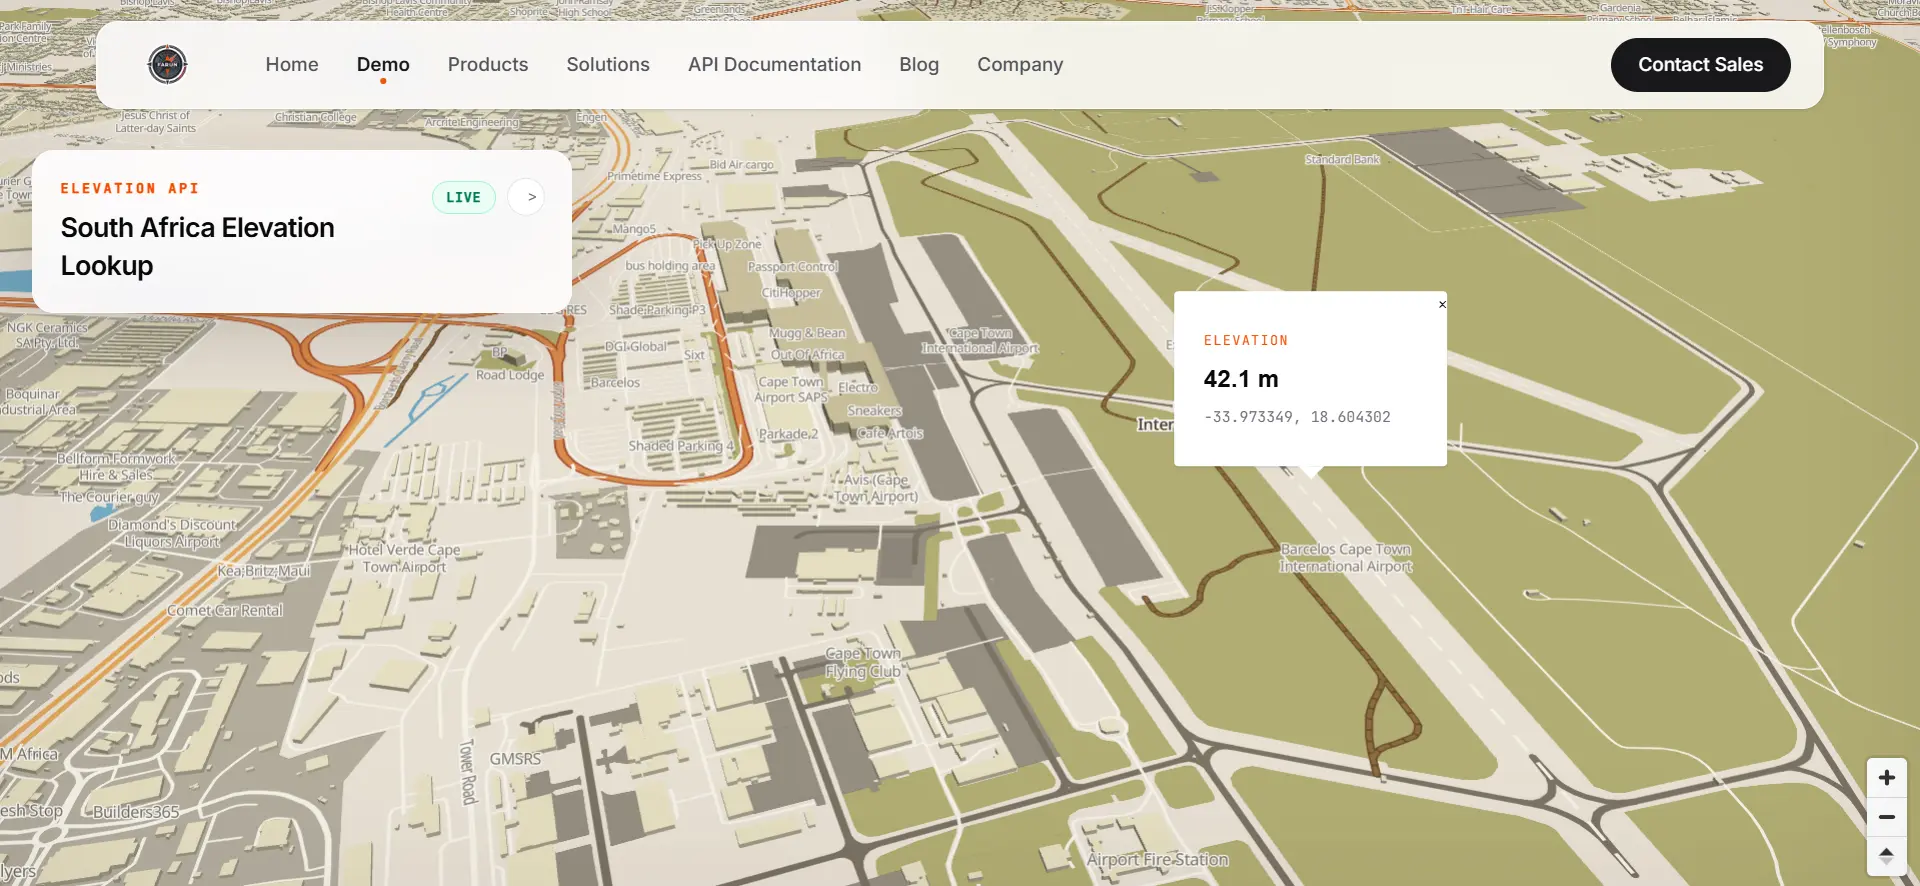
There are three broad ways to consume elevation data. A single point lookup returns one height value for one coordinate. A profile along a path returns many elevation samples along a route. A full grid or raster covers an entire area with elevation values for every cell in the grid. Each pattern serves a different use case, and most production systems end up using more than one.
What Is a Digital Elevation Model (DEM)?
A Digital Elevation Model (DEM) is a grid of elevation values covering an area, where each cell in the grid stores the height of the ground at that location. It is the underlying dataset that most elevation APIs and terrain maps are built from.
Think of a DEM as a raster image made of rows and columns. Each cell holds one number: the height of the ground at that location, usually in meters. A 30-meter DEM means each grid cell represents a 30-by-30-meter patch of ground, averaged into one elevation value. The smaller the cell size, the higher the resolution and the more detail the model captures.
The term “DEM” is often used as an umbrella term. More precise terms like DSM and DTM describe what the model actually includes. Those distinctions matter for accuracy, and they are covered in the next section. For a formal definition and history, see Wikipedia, Digital elevation model.
What Is the Difference Between a DSM, a DTM, and a DEM?
A Digital Surface Model (DSM) includes buildings, trees, and other objects on top of the ground. A Digital Terrain Model (DTM) strips those objects out and shows bare earth only. “DEM” is often used loosely to mean either one, so checking a dataset’s actual type matters before using it.
A DSM over a forest measures the tree canopy height. A DTM over the same forest measures the ground beneath the trees. The practical risk is real: using a DSM when you need bare-ground elevation introduces meters of error. A construction grading project that relies on canopy height instead of ground height will produce wrong earthwork calculations.
| Model | Includes buildings/trees? | Typical use |
|---|---|---|
| DSM (Surface Model) | Yes | 3D city models, line-of-sight, canopy height |
| DTM (Terrain Model) | No, bare earth only | Construction, hydrology, slope analysis |
| DEM (general term) | Depends on source, check metadata | Umbrella term; verify before use |
Always check a dataset’s documentation to confirm whether it is a DSM, a DTM, or something in between before building a feature around it. Farun.one uses DEM type data which provides one height number per coordinates.
How Is Elevation Data Collected?
Elevation data is collected using satellite radar, stereo satellite imagery, airborne LiDAR, or ground survey equipment, each method trades off coverage, resolution, and cost differently, which is why no single elevation dataset is best for every use case.
Satellite Radar (SAR / InSAR)
Radar interferometry bounces radar signals off the Earth’s surface from two slightly different angles and calculates height from the phase difference. This is how missions like SRTM captured near-global coverage in a matter of days rather than years.
Stereo Satellite Imagery (Photogrammetry)
Two or more optical images of the same area, taken from different angles, let software triangulate height the way human stereo vision judges depth. Cloud cover is the main weakness of this method.
LiDAR
Airborne or ground-based lasers measure the time it takes light to bounce back from the surface, producing extremely high-resolution, high-accuracy elevation data, at a much higher cost and with far more limited coverage than satellite methods.
Ground Survey and GNSS
Traditional survey equipment and GNSS receivers measure elevation directly at specific points, providing the highest accuracy of any method but only at the exact points measured, impractical for covering large areas.
For a visual walkthrough of these collection methods, see this Digital Elevation Models.
What Are the Most Common Global Elevation Data Sources?
The most widely used global elevation sources are SRTM, NASADEM, Copernicus DEM (GLO-30), and ASTER GDEM, each with different resolution, coverage, and accuracy trade-offs that matter depending on the project.
| Source | Resolution | Coverage | Notes |
|---|---|---|---|
| SRTM | ~30m (1 arc-second) | ~80% of Earth’s land (60°N–56°S) | Free, widely supported, captured in 2000 |
| NASADEM | ~30m | Same as SRTM | Reprocessed SRTM with fewer data voids |
| Copernicus DEM (GLO-30) | 30m (10m over Europe) | Global | Newer, generally considered most accurate global DSM available today |
| ASTER GDEM | 30m | ~80% of Earth | More artifacts in cloudy regions, sometimes better in rugged terrain |
Copernicus DEM has become the default choice for most new projects. SRTM remains useful specifically as a “circa-2000” elevation baseline for change-detection work. All four are free and publicly available, which is why most commercial elevation APIs are built on top of one or a blend of them rather than capturing new data themselves.
What Resolution Do You Need for Elevation Data?
The right resolution depends on the use case: 30-meter data is enough for regional route planning or flood-zone screening, while construction, drainage design, or precision agriculture usually need 1-meter or better LiDAR-derived data.
There are three concrete resolution tiers to consider. 30 meters or coarser works for regional planning, national risk models, routing planning, and broad terrain visualization. 5 to 10 meters fits local terrain context, hillshading, and ag-tech field maps. Under 1 meter is required for engineering, construction grading, and precision drainage design.
Over-fetching is a real problem. Pulling 1-meter data for a country-scale dashboard wastes bandwidth and storage without adding usable detail at that zoom level. Under-fetching is just as risky. Thirty-meter data will smooth out real features like small drainage channels or short steep slopes that matter for flood or landslide risk at a property level.
Match the resolution to the decision the data supports, not to what sounds impressive.
How Accurate Is Elevation Data, and What Causes Errors?
Most global elevation datasets have a vertical accuracy between 4 and 16 meters, with error increasing in steep terrain, dense forest, and urban areas where radar and photogrammetry struggle to isolate the true ground surface.
SRTM’s absolute vertical accuracy is generally cited around 16 meters or better. Newer sources like Copernicus DEM tighten that considerably. The main error sources are straightforward. Dense vegetation canopies get measured instead of the ground beneath them. Steep slopes amplify small horizontal errors into large vertical ones. Cloud cover disrupts optical stereo methods.
A practical rule of thumb: always check whether accuracy is stated for flat open ground or validated in the specific terrain type a project actually needs. Mountains, forest, and farmland behave very differently from a test field in Kansas.
What Is an Elevation API and How Does It Work?
An elevation API is a service that returns the height above sea level for a given coordinate (or a series of coordinates) without requiring the developer to download, store, or process a raw DEM file. You send coordinates; the API returns meters.
Raw global DEM files can run into hundreds of gigabytes. An API lets a developer skip storage and processing entirely and just ask a question. The general request shape is simple: send one or more latitude and longitude pairs, get back an elevation value per coordinate, usually in meters, sometimes selectable in feet.
Most elevation APIs sit inside a broader location API platform alongside routing, search, and matrix endpoints. Elevation is rarely a standalone product, since it is most useful combined with other spatial data. Farun’s Elevation API is one example, it lives inside the same platform as routing, isochrones, and search, so you can layer terrain data onto a route without managing separate vendors.
What Is the Difference Between Point Elevation Lookup and a Route Elevation Profile?
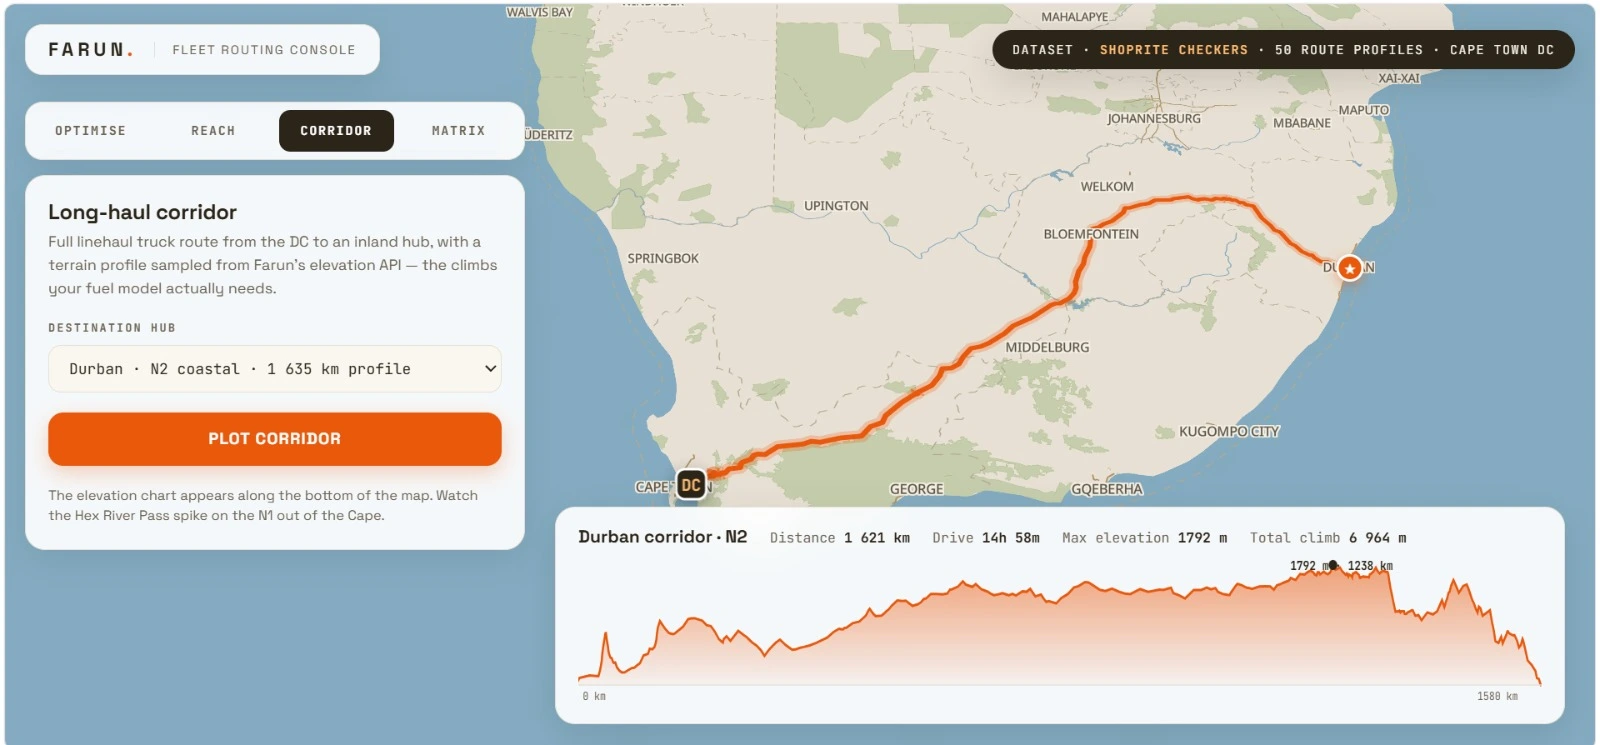
Point elevation lookup returns a single height value for one coordinate. A route elevation profile returns an array of elevation values sampled along an entire path, showing how height changes from start to finish, useful for climb, descent, and grade calculations.
Point lookup takes one lat/lng and returns one number. A profile takes a path, a list of coordinates or an encoded polyline, and returns many elevation samples along it. A point lookup answers “what is the elevation of this delivery address.” A profile answers “how much total climb does this cycling route have.”
The profile response is what powers elevation-gain charts in hiking and cycling apps. That jagged line graph under a route map is simply an array of elevation values plotted against cumulative distance. For the exact request and response schema for both endpoint types, see the Farun API documentation.
What Is the Difference Between an Elevation API and Terrain-RGB Map Tiles?
An elevation API returns exact numeric values for specific coordinates you request. Terrain-RGB map tiles encode elevation into the color channels of standard map image tiles, letting a map client decode height client-side for an entire visible area at once, better for rendering, worse for precise single-point queries.
Terrain-RGB packs elevation into the red, green, and blue color values of a PNG tile using a fixed formula. A browser or mobile app can decode height for every pixel on screen without a separate network request per point. An elevation API is the right tool when you need a precise value for a known coordinate, a delivery address, a sensor location. Terrain-RGB tiles are the right tool when you are rendering 3D terrain, hillshading, or a whole map view at once.
The two are not mutually exclusive. Many mapping stacks use Terrain-RGB tiles for visual rendering and a separate elevation API call for precise point queries like “what is the elevation right here.”
For the clearest public reference on how Terrain-RGB encoding works, see the Mapbox Docs - Access elevation data.
How Do You Add an Elevation Profile to a Route or GPX Track?
Add an elevation profile by sampling elevation values at regular intervals along a route’s coordinates, then plotting those values against cumulative distance, most elevation APIs accept a full path or encoded polyline and return this array directly, removing the need to sample manually.
The basic implementation pattern is straightforward. Get the route geometry from a GPX file or a routing API response. Send it to an elevation profile endpoint. Receive an array of elevation samples. Compute total ascent and descent by summing positive and negative changes between consecutive samples.
One common pitfall is sampling too sparsely. Few points across a long route understate real climb and descent, since it smooths out short, steep sections between sample points. This is exactly how GPX-based hiking and cycling apps generate the elevation gain and loss numbers shown next to a route summary.
How Does Elevation Data Improve Routing, Isochrones, and Reachability Models?
Elevation data improves routing by revealing real climb and descent that flat road data cannot show, and it improves isochrones by making reachable-area estimates account for terrain difficulty instead of only road distance and speed limits.
Two routes with identical distance can have very different real travel times and fuel costs if one climbs 400 meters and the other stays flat. A pure Routing API response gives distance and duration, but it does not expose that difference without elevation context layered on top.
A 30-minute Isochrone around a mountain depot looks very different once elevation-driven speed reductions on steep segments are accounted for, versus a flat-terrain assumption. The reachable area shrinks on the uphill side and expands on the downhill side in ways a circle on a map cannot predict.
This combination matters most for cycling and hiking route planners, EV range estimators, and rural or agricultural logistics tools where terrain genuinely changes travel time.
Which Industries Rely on Elevation Data the Most?
Agriculture, insurance, automotive, marine, and outdoor recreation apps are the heaviest users of elevation data, each for a different reason, from slope-aware irrigation to flood risk underwriting to EV range prediction.
Agriculture and Land Management
Elevation and slope data drive irrigation planning, drainage design, and land classification. A field’s slope directly affects water runoff and where equipment can safely operate.
Insurance and Risk Modeling
Elevation is a core input for flood risk and landslide risk models. Insurers use it to understand how far a property sits above a floodplain or how steep the surrounding terrain is.
Automotive and EV Range Planning
Elevation change along a planned route directly affects energy consumption in electric vehicles. Climbing drains a battery faster than flat driving, and descents can recover some of that energy. Automotive teams building range-prediction features need this data layered on top of standard routing.
Marine and Coastal Operations
Coastal elevation and bathymetric context matter for harbour planning, tide-aware navigation, and coastal risk assessment, where standard road-based map data provides no useful information at all. Farun’s marine solutions cover this alongside offline navigation for vessels.
Outdoor, Hiking, and Cycling Apps
Elevation gain and grade are core metrics hikers and cyclists check before committing to a route. This is the single most visible consumer-facing use of elevation profile data.
What File Formats Does Elevation Data Come In?
Raw elevation data is most commonly distributed as GeoTIFF (a georeferenced raster image format), while elevation APIs typically return simple JSON with numeric height values, the format you will touch depends on whether you are processing raw datasets or consuming an API.
GeoTIFF is a raster image file where pixel values represent height instead of color, plus embedded geographic coordinate metadata. It is the standard format for source DEMs from SRTM, Copernicus, and similar programs.
Terrain-RGB PNG tiles are a rendering-optimized alternative. Elevation is encoded into standard image color channels for direct use by map renderers, covered in more depth in the earlier Terrain-RGB comparison section.
API response formats are the simplest for application developers. Most modern elevation APIs return plain JSON, either a single numeric value for a point query or an array of values for a path query. No GIS software is required.
How Do You Choose an Elevation Data Provider?
Choose an elevation data provider based on coverage of your specific operating region, the resolution your use case actually needs, response format (raw files vs. API), and whether pricing scales sensibly with your expected request volume.
Use this checklist:
- Coverage check first, always. Confirm the provider actually has data for the exact region you operate in. Global claims sometimes hide regional gaps, so check a coverage page directly rather than assuming.
- Match resolution to use case, not to what sounds precise. See the resolution section above for concrete tiers.
- Decide between raw files and an API early. Raw DEM processing requires GIS tooling and storage. An API trades a per-request cost for zero infrastructure overhead.
- Check whether point lookup and path/profile queries are both supported. Most real applications eventually need both.
- Confirm pricing scales with actual usage rather than forcing a flat enterprise contract for a small side project.
What Are Common Mistakes When Working With Elevation Data?
The most common mistakes are using a DSM when a DTM is needed, sampling route elevation too sparsely, assuming global coverage without checking, and ignoring accuracy limitations in steep or forested terrain.
- Using a DSM when bare-earth data is required. Building and tree heights get baked into results, producing systematic errors in construction or drainage projects.
- Sampling too sparsely along a route. Undersampled elevation profiles smooth out short, steep sections and understate real climb and descent totals.
- Assuming a provider has global coverage without checking. Many elevation datasets and APIs cover specific regions first. Always verify against a coverage page before building a feature around it.
- Ignoring accuracy in difficult terrain. A dataset’s headline accuracy figure is often measured on flat, open ground. Real accuracy in mountains or dense forest can be considerably worse.
- Treating “DEM” as a precise technical term. Since it is frequently used loosely, always check a dataset’s actual documentation to confirm whether it is a DSM, DTM, or something in between.
Can Elevation Data Work in Offline or Low-Connectivity Environments?
Yes, elevation data can be bundled onto a device ahead of time as a local raster or tile set, letting offline navigation hardware display terrain and calculate grade without a live connection, though this requires planning the coverage area before departure.
The practical pattern is simple. Pre-download the elevation tiles or DEM extract for a planned operating area while online. Store it on-device. Query it locally during the trip. The trade-off versus a cloud elevation API is that offline data must be sized and scoped in advance. It works well for planned routes or defined operating regions, but poorly for arbitrary, unplanned queries outside that area.
This matters most in rural agriculture, marine navigation, and disaster response, all environments that combine low connectivity with a real need for terrain awareness.
What Are the Current Coverage Limitations of Elevation APIs?
Coverage varies significantly by provider, some elevation APIs are genuinely global, while others, including Farun’s Elevation API, currently cover a specific region rather than the whole world, so checking a provider’s actual coverage area before building on it is essential.**
Farun’s Elevation API currently covers South Africa only, as listed on the API coverage page, with additional regions planned as demand grows. This is not just a Farun-specific caveat. Any team evaluating an elevation provider should check the coverage page directly rather than assuming “elevation API” means global coverage by default.
The practical next step for teams needing a region not yet covered is to reach out. Providers expanding regional coverage typically take direct requests. You can contact Farun to flag demand for a specific area.
How Do You Get Started With an Elevation API?
Get started by picking a coverage-confirmed provider, requesting an API key, sending a single test point-lookup request, then expanding to path-based profile requests once the basic integration works, most elevation APIs can return a first result within minutes.**
- Confirm the provider covers your operating region. This is the single most important check before writing any code.
- Sign up and generate an API key, usually available on a free or evaluation tier for testing.
- Send a single point-lookup request with one known coordinate and confirm the returned elevation value looks correct.
- Move to a path-based profile request using a real route or GPX track to confirm elevation gain and loss calculations match expectations.
- Decide on caching strategy. Elevation for a fixed location rarely changes, so caching aggressively reduces both cost and latency for repeat queries.
- Read the full API documentation for exact parameter names, batch limits, and response schema before building production logic around it.
FAQs About Elevation Data APIs
Q1: What’s the difference between elevation and altitude?
A1: Elevation measures height above sea level for a fixed point on the ground. Altitude typically measures height above ground level for something in the air, like an aircraft or drone. Maps and elevation APIs almost always report elevation, not altitude.
Q2: Is elevation data free to use?
A2: The underlying global datasets (SRTM, Copernicus DEM, ASTER GDEM) are freely available for download, but most developers use a paid or freemium elevation API instead to avoid processing raw files themselves. Pricing varies by provider and request volume.
Q3: How often is elevation data updated?
A3: Static terrain elevation changes very slowly, so most providers update on an infrequent schedule tied to new satellite missions or datasets rather than continuously. Copernicus DEM, for example, was captured between 2011 and 2015 and has been treated as a stable baseline since.
Q4: Can elevation data detect building height?
A4: Only if the underlying dataset is a Digital Surface Model (DSM), which includes buildings and vegetation. A Digital Terrain Model (DTM) strips buildings out entirely and will not reflect them.
Q5: Do I need a separate API for elevation, or does my routing API include it?
A5: Most routing APIs return distance and duration only, not elevation. A dedicated elevation lookup or profile endpoint, often part of the same provider’s API platform is needed to layer terrain data onto a route.
Q6: What coordinate format do elevation APIs expect?
A6: Nearly all elevation APIs expect standard latitude and longitude pairs (WGS84), the same coordinate system used by GPS and most mapping tools. No special conversion is typically needed.
Which Elevation Data Approach Should You Use?
Use a raw DEM file for offline processing or GIS analysis, Terrain-RGB tiles for rendering terrain on a map, and an elevation API for precise point or route queries inside an application, most production systems end up using more than one of these together.
Use this short decision checklist:
- Rendering 3D terrain or hillshading on a map → Terrain-RGB tiles.
- Need one exact elevation value for a known coordinate → elevation API point lookup.
- Need climb and descent totals along a route or GPX track → elevation API path/profile endpoint.
- Running offline GIS analysis across a large custom region → raw DEM file (GeoTIFF).
- Building for a region with confirmed coverage and want zero infrastructure overhead → a hosted elevation API.
Try a live point lookup in the interactive Elevation Explorer. Or talk to our team about expanding coverage to your region.